
Analyzing Geometric Perspectives and
Time Cycles.
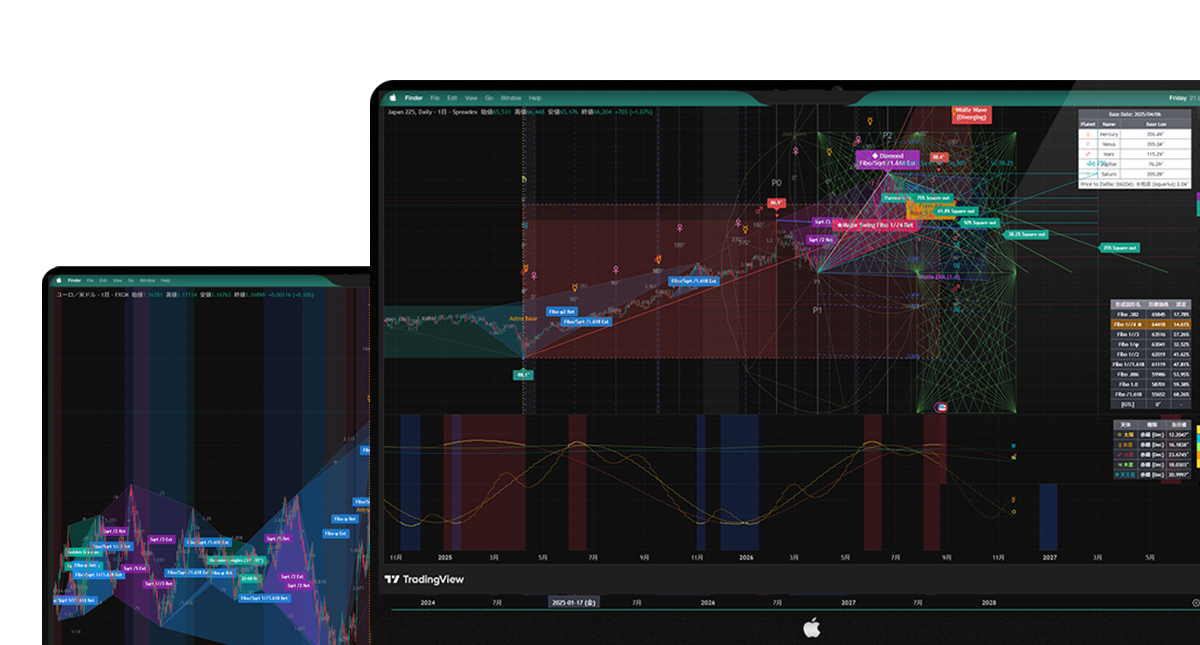
Analyzing Charts from a "Geometric Perspective."
This tool is an analysis support software designed to calculate and draw geometric orders and cycle patterns latent in technical charts, treating them as two-dimensional planes of price (Y-axis) and time (X-axis). It supports users' own chart research and analysis by visualizing objective formulas and mathematical ratios.
Geo Metrix
Geo Metrix: A research and analysis support tool that reproduces drawing and calculation features on charts based on market geometry and cycle theory. It calculates and visualizes geometric reference lines and forecasting auxiliary lines in the time-price domain based on mathematical ratios such as Fibonacci ratios, square roots, and trigonometric functions. With this single tool, you can seamlessly utilize a total of 18 diverse analysis features.

¥15,000 - One-time payment
Fast and secure payment by Stripe, Instant Download
Harmonic Metrix
Harmonic Metrix: A tool designed to assist in the research and visualization of harmonic geometric ratios and structural patterns appearing on charts. Equipped with support functions for users to draw and analyze geometric shapes based on the golden ratio, it does not encourage specific trading decisions, but visually organizes key pattern structures (such as Gartley and Bat ratio patterns) and calculated reference areas (PRZ: Potential Reversal Zones) to support multi-dimensional chart research.
¥15,000 - One-time payment
Fast and secure payment by Stripe, Instant Download
Astro Metrix
Astro Metrix: An analysis support tool
designed for researching and visualizing the temporal
relationship between planetary movement data (aspects,
retrogrades, etc.) and price charts, plotting various aspect
cycles and reference lines on the main chart to organize
time-price relationships.
Astro Wave
A research tool that calculates planetary movement data
(longitude, right ascension, declination, Out of Bounds, etc.)
and plots them as wave cycles on a sub-chart, designed to
assist users in visually comparing and analyzing planetary
cycles with chart price movements.
¥15,000 - One-time payment
Fast and secure payment by Stripe, Instant Download
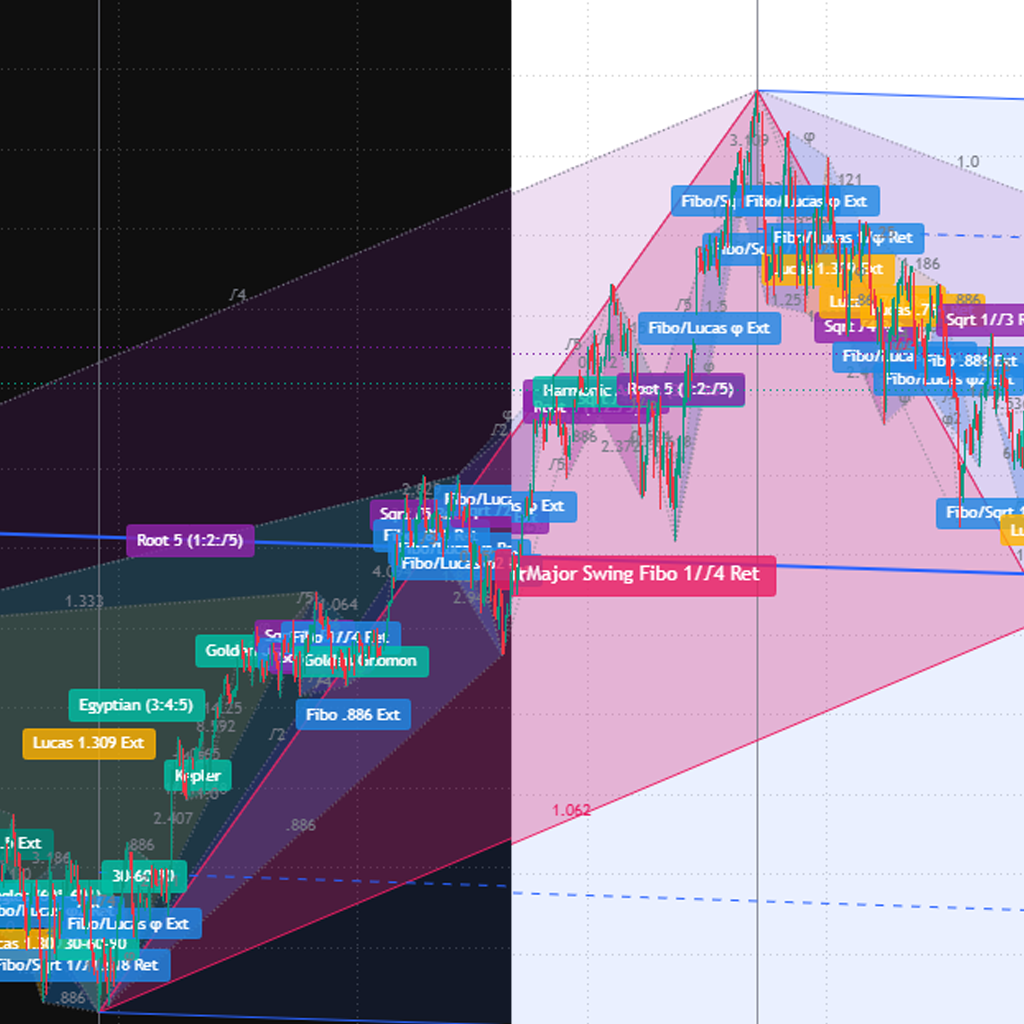
Dark Mode / Light Mode Support
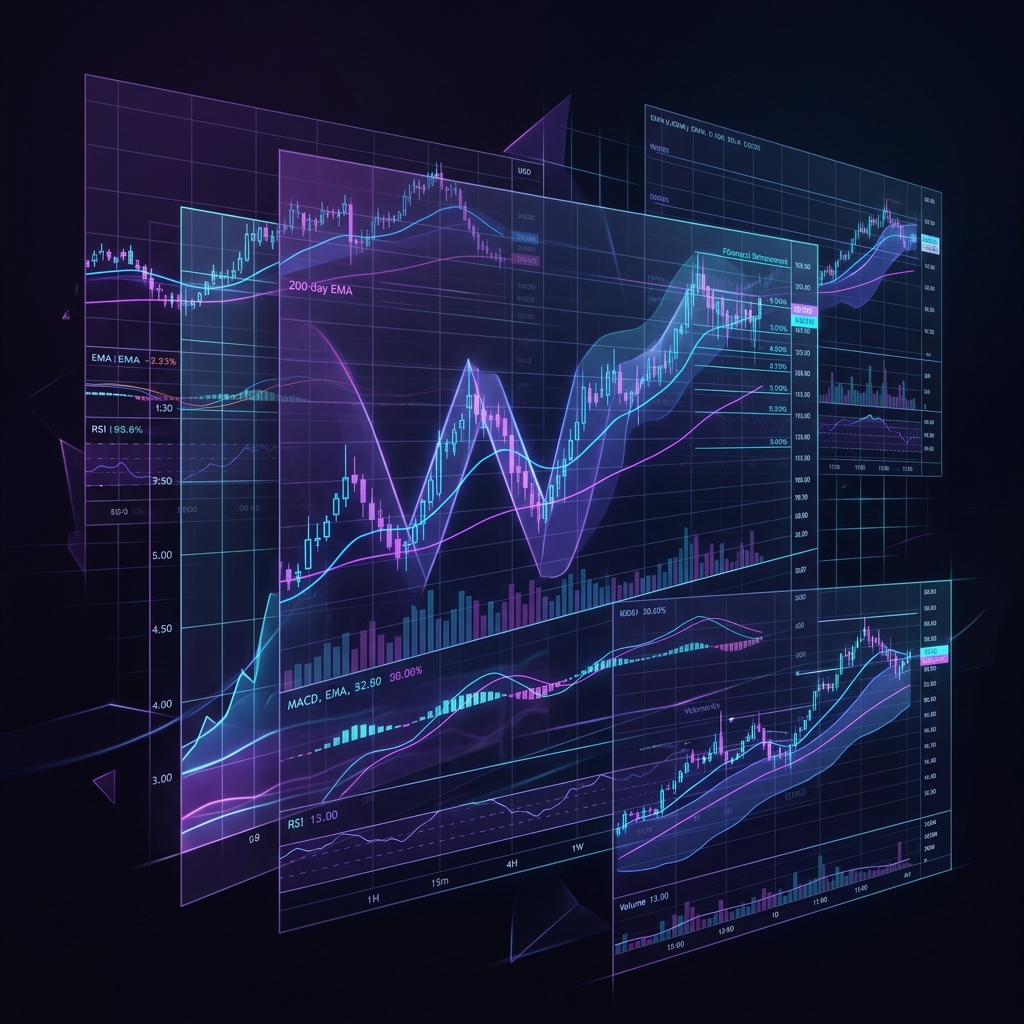
Multi-Timeframe (MTF) Support
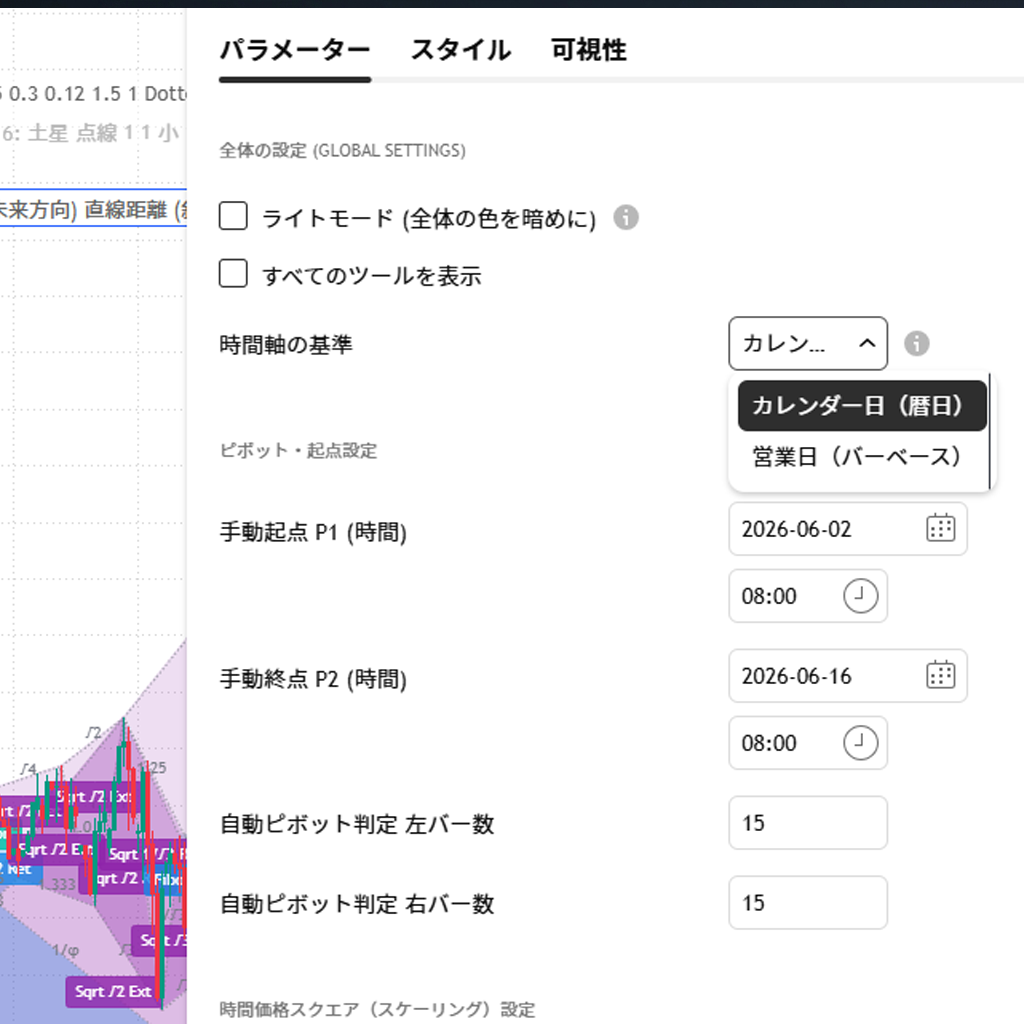
Calendar & Trading Days Switchable
Frequently Asked Questions
METRIX is analysis and research software that treats price and time as a two-dimensional plane, visualizing geometric ratios, mathematical models, and cycle data on charts.
METRIX is not an investment advisory service.
It does not recommend or solicit the trading of specific financial
products, nor does it predict or guarantee future prices or
profits. It is a visualization tool designed to assist users in
their own chart research and analysis.
[Important Disclaimer]
This product (various indicators and calculation tools) is an "analysis, research, and learning software" that provides chart analysis based on historical market data and drawing functions based on geometric ratios and astronomical cycles. It is intended to support the user's own chart research, analysis, and learning, and does not constitute a solicitation, recommendation, or advice to buy or sell any financial products, nor does it generate specific trade signals for automated trading. We do not provide services corresponding to investment advice or transaction execution.
Any forecasting auxiliary lines, values, and graphs generated by this software are based on historical market data and do not guarantee or promise future price fluctuations or investment profits. Past performance and verification results do not guarantee that similar results will be achieved in the future.
Financial trading in equities, foreign exchange, cryptocurrencies, commodities, etc., involves significant risks, including the risk of losing principal. This website and its operators assume no liability for any direct or indirect losses incurred as a result of using this software or referencing the data. All investment decisions and trading actions must be made at the user's own discretion, judgment, and risk.